
The most common use case for the FortiGate is to function as a security device and protect assets on the network. It is also used to provide intelligent routing and network resiliency with its built-in SD-WAN. These use cases are known and relatively well documented. However, this functionality can be extended to other applications with the addition of the built-in automation capability of the FortiGate.
I recently came across an issue where a manager of a distributed network was encountering a problem with a specific web application losing connectivity randomly throughout the day. This particular application is hosted in AWS and the manager isolated the issue to only happen at one site out of the 50+ sites that they are managing. This manager has a performance SLA configured on the FortiGate at this site to gather network statistics on the application and to get notification when the application is not reachable from this site.
Providing this awareness is invaluable to the administrator because it is a proactive notification of when the problem occurs, however, there is no additional information beyond the link being down that is being captured to help troubleshoot this issue. While working together on this issue, we came up with a way to automate gathering more information from the network troubleshooting tools built into the FortiGate and sending that information to the administrator via an email.
Defining the Unfavorable Network Condition
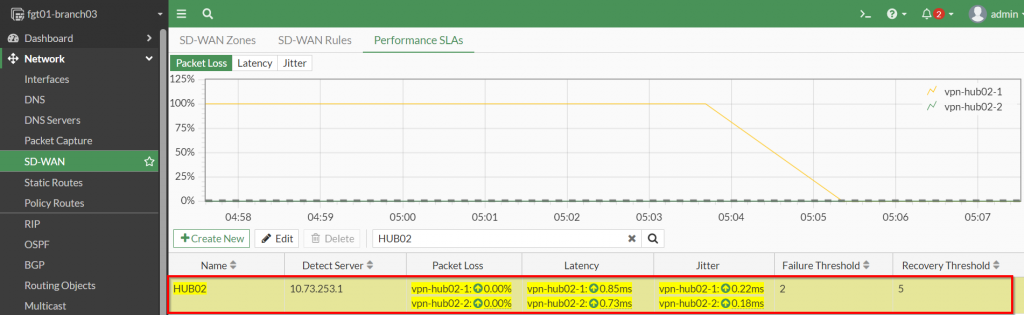
The built-in SD-WAN capability of the FortiGate provides network monitoring that provides a deeper insight to how the network is performing. This is one of the main reasons why I recommend to always enable SD-WAN as a best practice, even if there is only one WAN connection configured on the FortiGate. In my lab environment below, it is configured to perform monitoring to a remote site and will allow alert when the thresholds in the performance SLA have been exceeded.
Here are some screenshots of those corresponding settings from my lab FortiGate GUI.
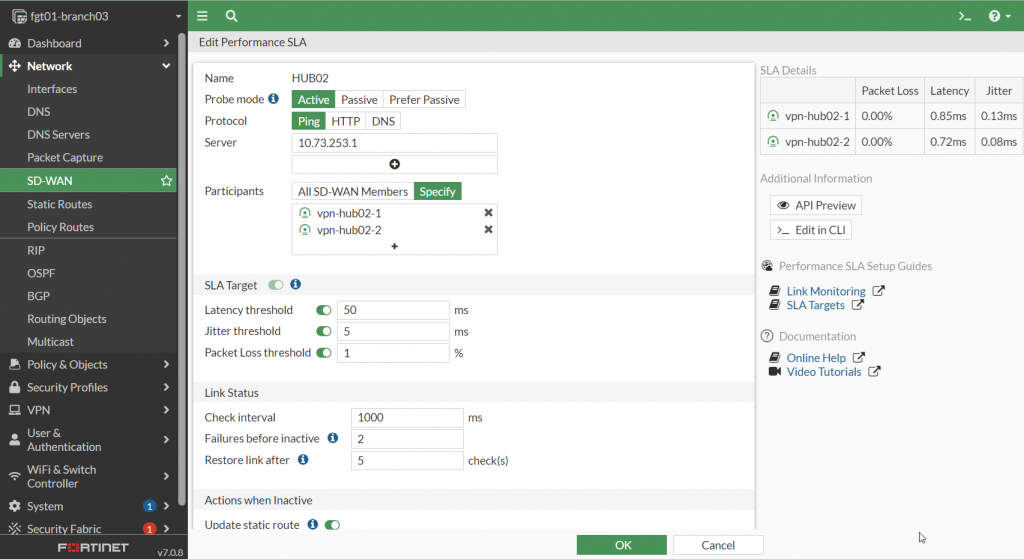
Please Note: The SLA target parameters should be configured for the ideal performance of the application so the FortiGate can provide a notification right at the point of degradation of user experience.
After the Performance SLA has been defined, the automation of the commands used to perform troubleshooting can be created.
Automating the Gathering of Information to Troubleshoot the Network
Before diving into the details about setting up the automation features on the FortiGate, I want to highlight some of the commands available for network troubleshooting.
Troubleshooting tools
The FortiGate supports a myriad of tools that most administrators can use to isolate where the problem is occurring in their network. Here is a list of some of these tools:
- PING
- TRACEROUTE
- ARP
- SPEEDTEST
- PACKET CAPTURE
- DEBUG FLOW
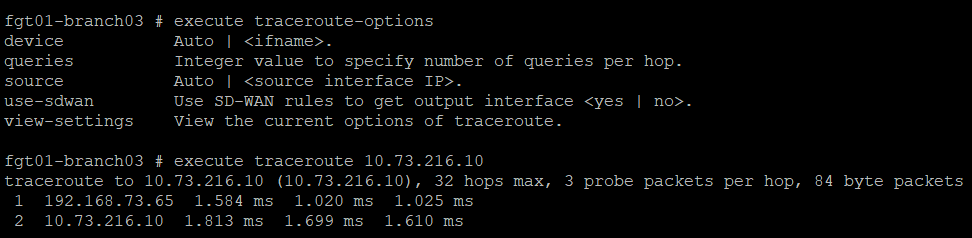
For the purpose of this article, we will be focusing on the use of the traceroute tool to identify where in the network path where an issue may be occurring. An example showing this tool in action from the command line is shown in the screenshot below:
Now that the tool used for troubleshooting has been identified, the next step is to automate the use of this command when the SLA target threshold has been exceeded. To do this, we will need to confirm that a log is written when this event happens on the FortiGate.
Capturing the event in a log file
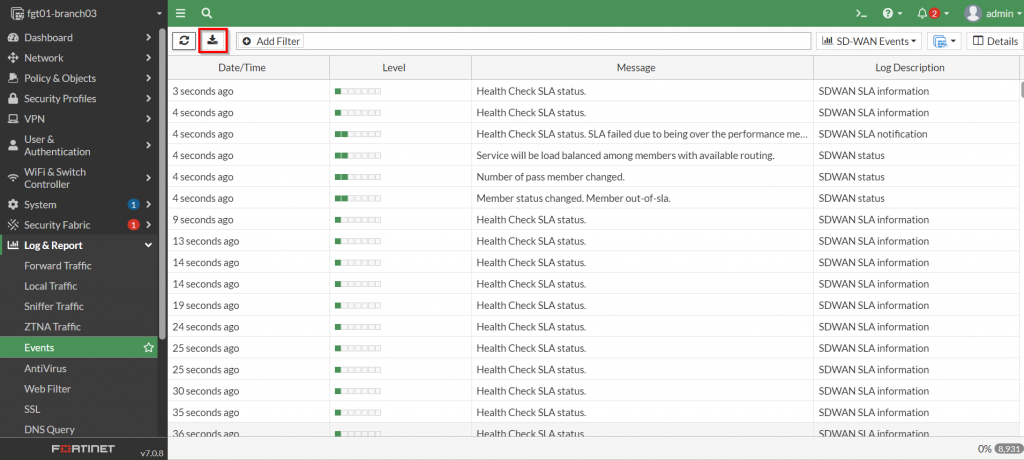
Confirming that the FortiGate creates a log file when a particular event you want to automate a response to is critical because that log event is used as a trigger to kick off the response. In the case of exceeding the thresholds for a defined performance SLA, the FortiGate a few log entries for this type of event. Below is a screenshot from the FortiGate GUI showing the associated logs:
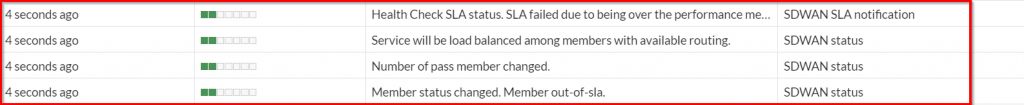
From the screenshot above, the entry with the message “Health Check SLA status. SLA failed due to being over…” is the applicable log that can be used to perform the automation task on.
The GUI is useful in confirming that the log entries exists, but to gather the information necessary for creating an automation, the raw syslog needs to be downloaded from the FortiGate. Here is a screenshot showing where to download this information from the FortiGate GUI:
Once the file has been downloaded, its contents can be viewed in a text editor similar to what is shown in the screenshot below:

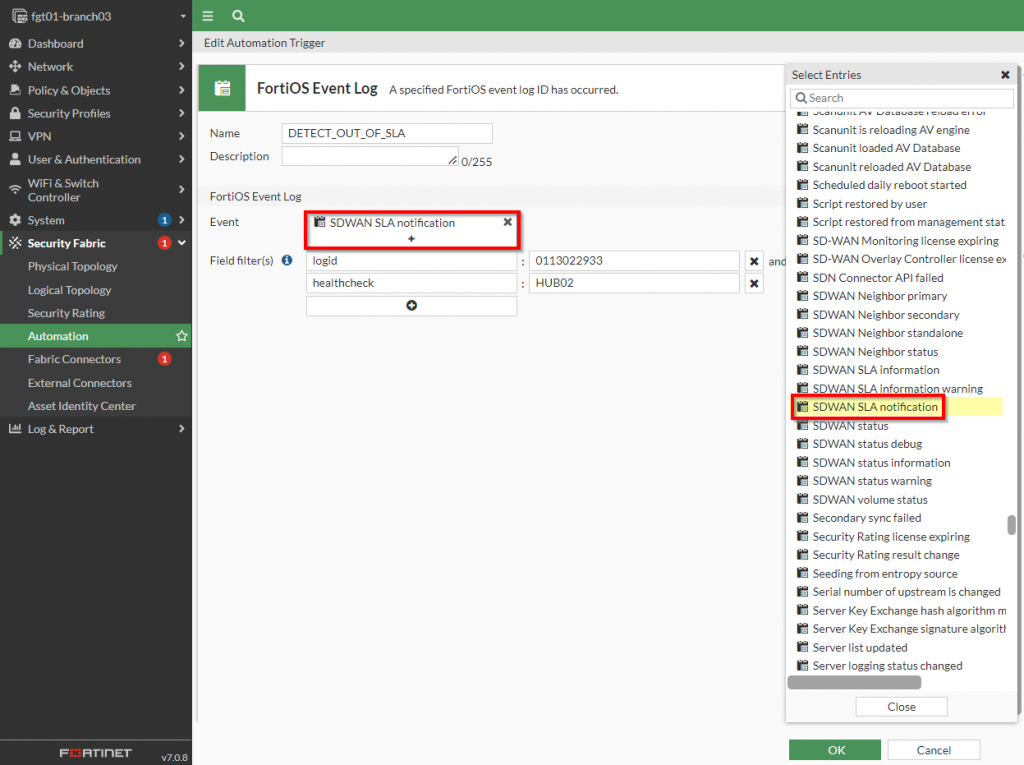
The fields to take note of from this syslog are the following:
- logid – 0113022933
- logdesc – “SDWAN SLA notification”
- healthcheck – HUB02
Now that this information has been gathered, the automation can be created.
Creating the Automation
Creating an automation on the FortiGate comprises of three components:
- Trigger – Event that the FortiGate will detect to perform a response
- Action – The response that the FortiGate will take once it detects the “trigger” event
- Stitch – The object used to associate a trigger with an action
With an understanding these components, below is an example of putting them together to perform an automated troubleshooting response once the FortiGate detects that the performance SLA threshold has been exceeded.
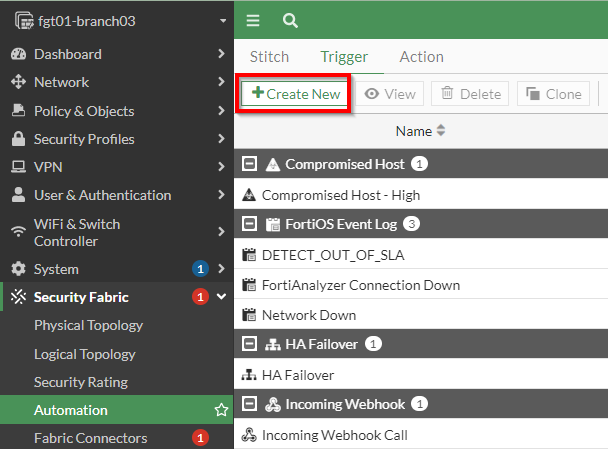
Creating a Trigger to Detect when the Performance SLA is exceeded
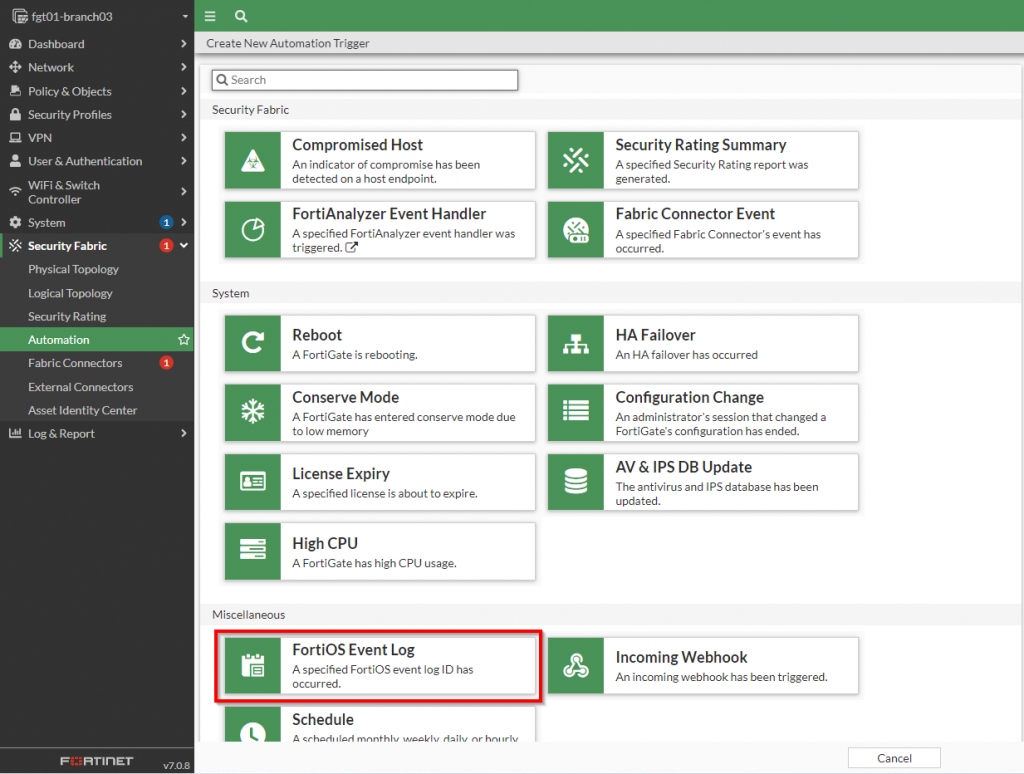
Earlier in the “Capturing the event in a log file” section, I showed an SD-WAN event log that is recorded with the Performance SLA is exceeded. To create a trigger that can detect this exact log file, a new trigger is created with the type of “Miscellaneous | FortiOS Event Log” as shown in the screenshot below:
Once this has been selected, a new dialog box will appear with the criteria to specify for matching the specific event. To initiate the match for the event, the “Log Description” from the event should match from the list of options that are presented in this dialog box. In addition to that, specific fields within that log file can be specified as well as shown in the screenshot below:
After all of those settings have been set, the next step is to define the action the FortiGate should take once that condition has been met.
Defining Actions to take when the Performance SLA is exceeded
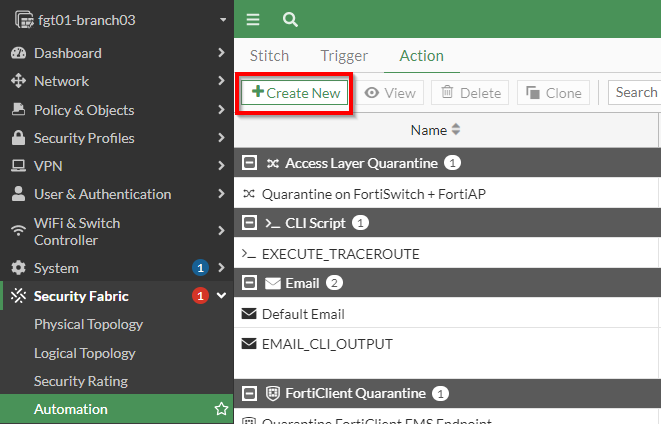
Once the FortiGate has detected its performance SLA has been exceeded, we want it to perform a traceroute against an endpoint and email those results to our distribution list. The first step is to execute commands on the FortiGate to perform the traceroute. To get started a new action needs to be created as shown in the screenshot below:
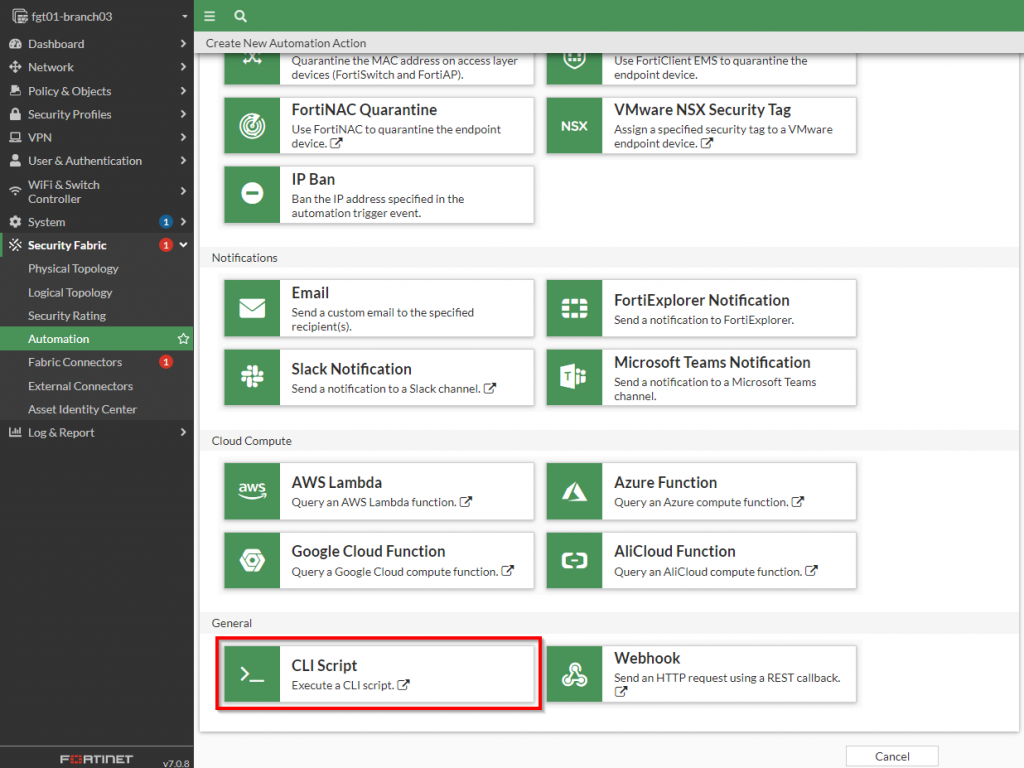
Creating a CLI Action to Perform a Trace Route
The “CLI Script” action should be selected to execute the traceroute commands on the FortiGate. Below is a screenshot of where this action can be selected:
Once that action has been selected, the “execute traceroute <ip address or fqdn”> can be specified. Below is a screenshot showing this configured:
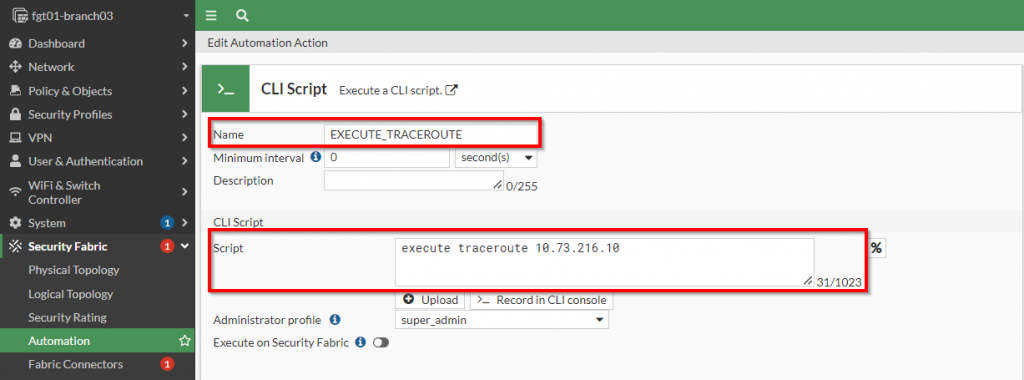
Since I want this action to trigger each time the event is detected, I am setting the “minimum interval” to “0”. However, if I want to limit the amount of times this action is triggered within a given interval, I can set the “minimal interval” to a time period where the action will only trigger once within that time period.
Please note: Variables extracted from the fields of the log file can be used within the “script” section. For details about those fields, please click the “%” button next to the “script” field.
Once I have executed the trace route command, I would like to capture its contents and send an email to myself with the results. To do this, a subsequent action to email the results needs to be created.
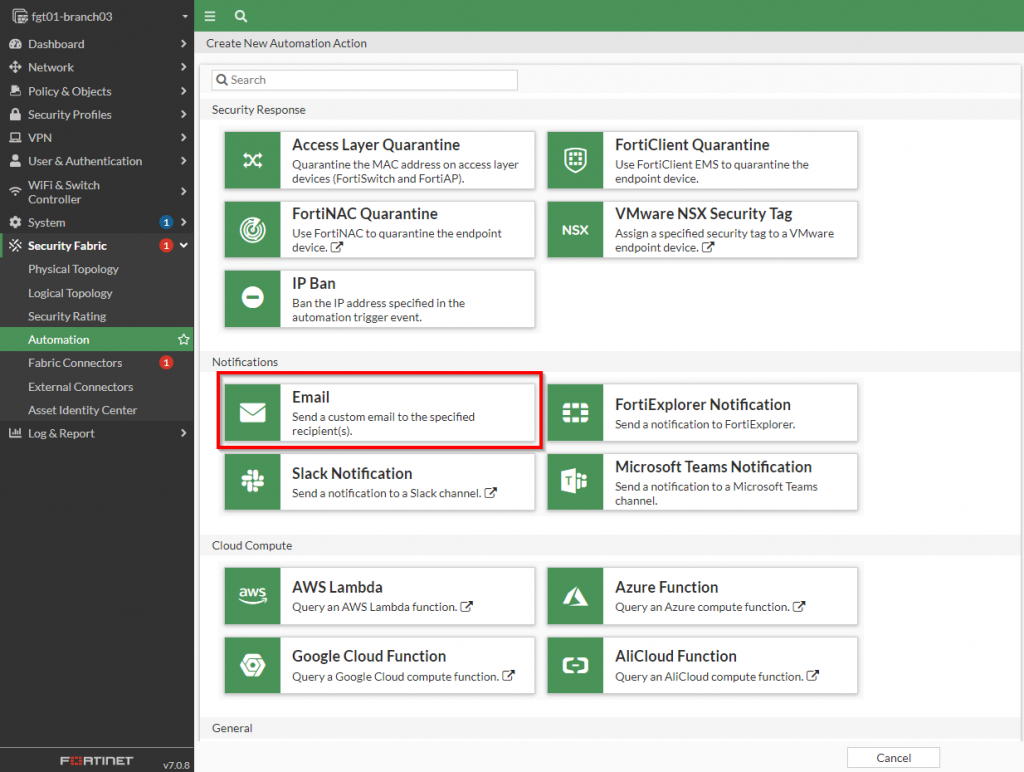
Creating a CLI Action to Email the contents from the CLI Script
A new action of the notification type can be created to send an email. This type of action can be selected from the “Create New Automation Action” page as shown in the screenshot below:
Once the email dialog box has been opened, the fields to populate the email can be specified. Below is a screenshot with an example from my lab:
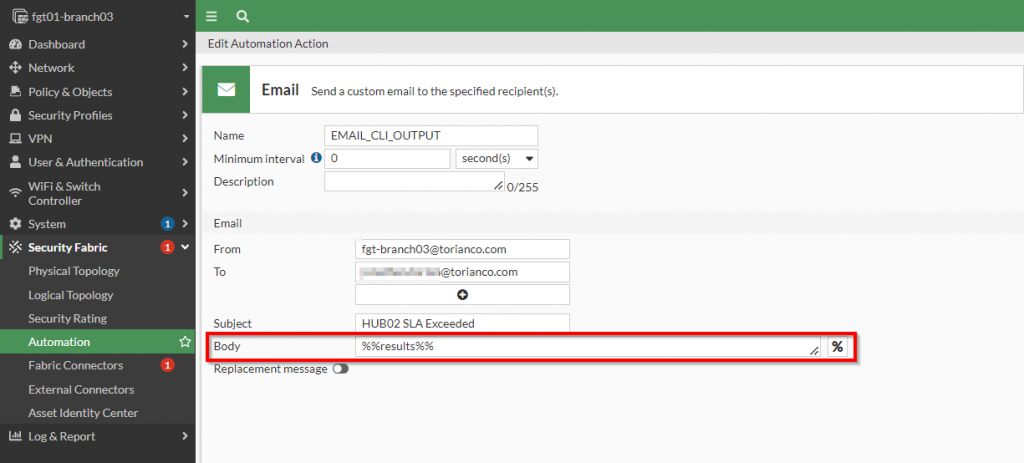
The most important part of defining this option is that the variable “%%results%%” is specified in the body of the email. This special variable takes the content of the action before it and populates the email with that output. In this case, this action will take place after the CLI script so that it will take the command output and include it in the body of the email.
Now the actions have been created, the only remaining task is to stitch the trigger and action together.
Stitching the Trigger and Action together for an automated response
The automation stitch allows the Fortinet administrator to define the “order of operations” when it comes to detecting an event and performing actions to respond to it. In this use case, I want to first detect that the performance SLA has been exceeded, perform a traceroute to gather information about the network path and lastly, email those results to myself. To accomplish this, I have created a automation stitch as shown in the screenshot below:
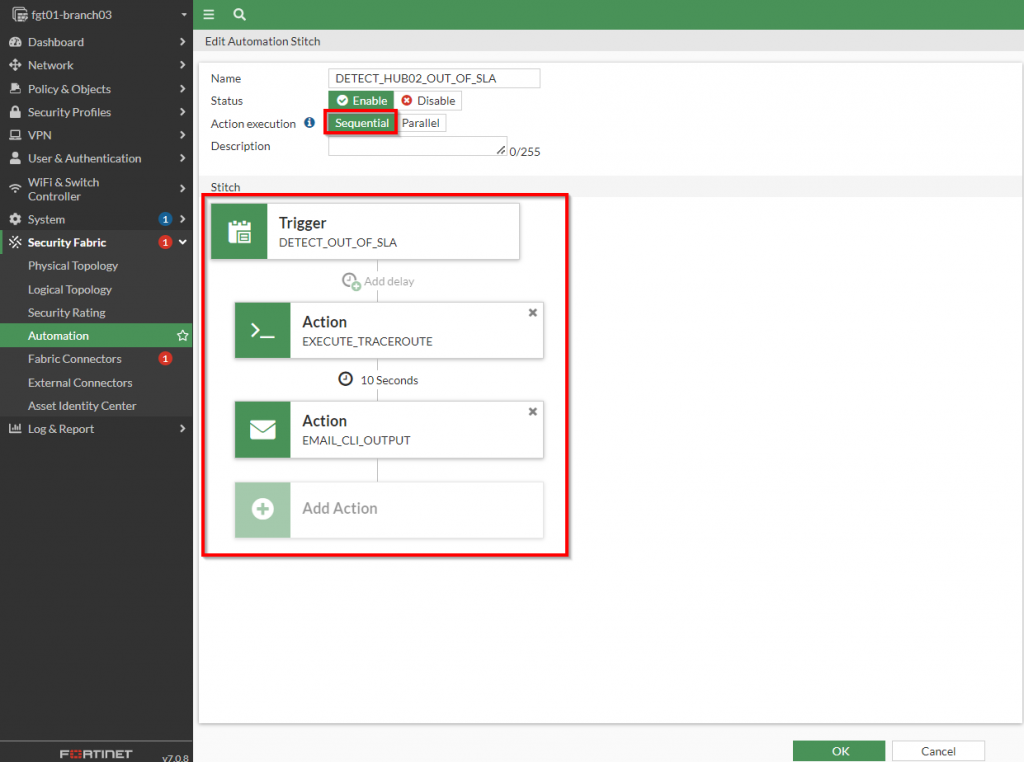
The important points to highlight about this stitch is that the actions are performed “sequentially” (one after the other) instead of parallel (all at the same time). This is important because the traceroute command needs to complete before there is an attempt to email those results. Also, there is a slight delay of 10 seconds between when the trace route is performed to when those results are emailed because it does take the traceroute some time to complete. Adding this delay ensures I allow the command to complete for the full results.
Once this is created, the results can be validated by exceeding the threshold on the performance SLA.
Validating the results
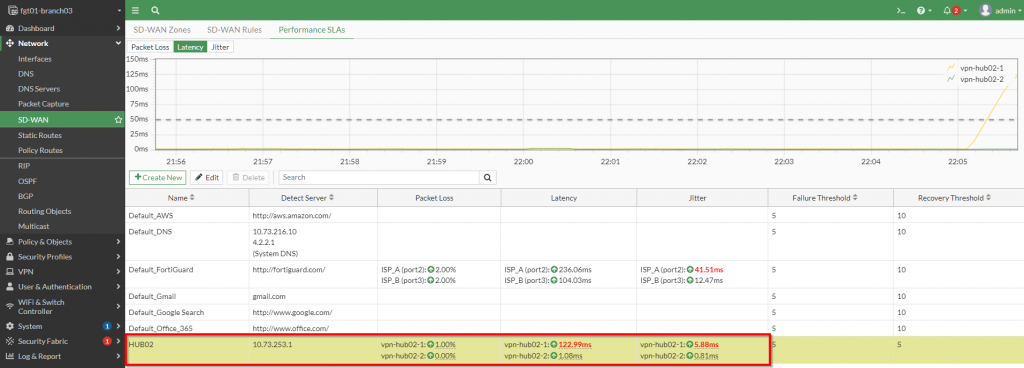
To validate the results, I am going to exceed the Performance SLA in my lab environment. Here is a screenshot showing the performance SLA exceeded for the “HUB02” healthcheck.
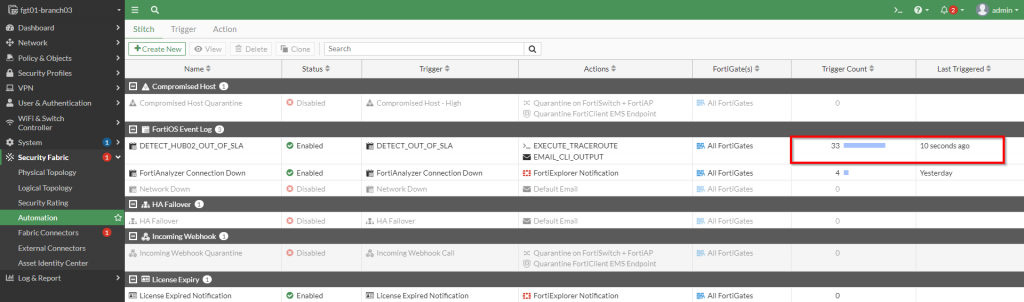
The next step is to check to see if the automation was triggered. This is easily done within the “Security Fabric | Automation | Stitch” section by observing the “Trigger Count” and “Last Triggered” columns as shown in the screenshot below:
Lastly, we can check the email inbox to confirm that the command was executed and we have its results. Here is a screenshot showing the output that was gathered and sent via email:
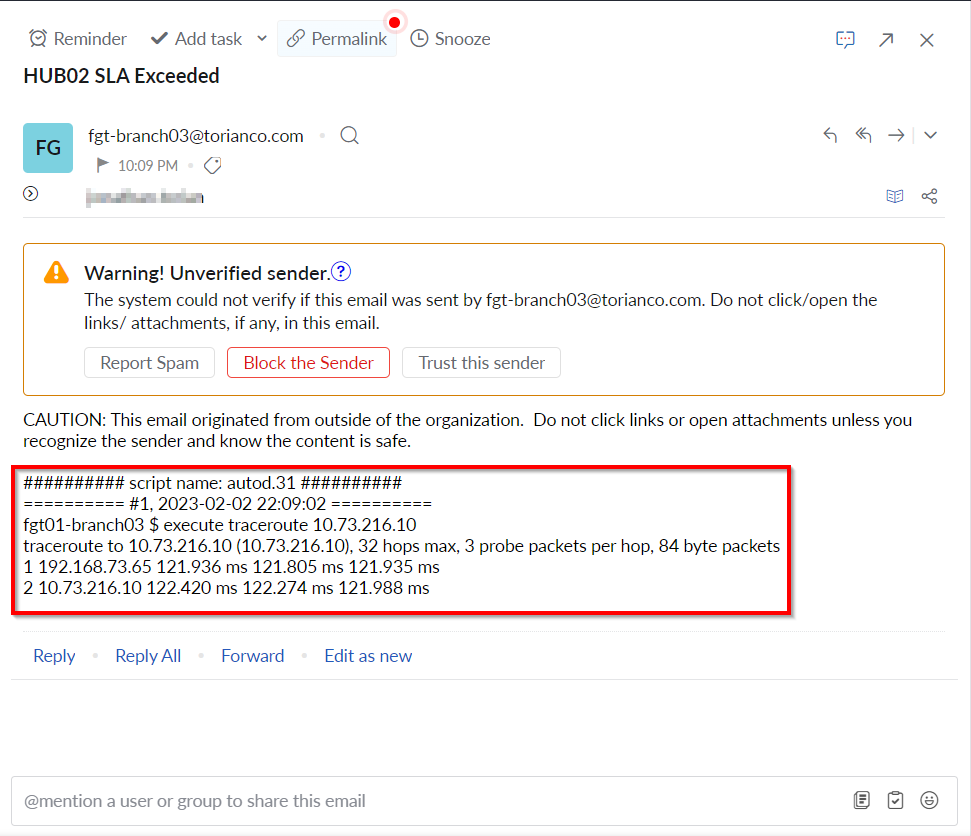
Please note: If you are using the default Fortinet servers for email delivery, you may need to check your SPAM filter to make sure the email was not misidentified as SPAM.
I hope that this proved to be a very useful article in showing an “outside of the box” application for SD-WAN and the automation capabilities of the FortiGate. As always, please leave a comment below and let me know your thoughts. I hope this helps!
Thank you for this post. I have really learnt a lot. Is the SLA target to the Hub? Where is the 10.73.216.10? I complete topology will help some of us.